
Santa Clara County Real Estate
January 2020 ReportGenerally speaking, after years of high appreciation rates, annual 2019 Bay Area median home prices went down a little bit, went up a little bit or basically remained unchanged as compared to 2018. Santa Clara County prices dropped the most in the Bay Area, but it must be remembered that it appreciated the most in the previous year. Indeed, Santa Clara may have been the hottest market in the country from mid-2017 to mid-2018, before suddenly cooling down.
For 2020, economist Ken Rosen at UC Berkeley has said he expects the Bay Area median price to remain basically flat, within a general range of up or down 2% - in other words, roughly similar to what happened last year. We can’t predict the future, but that doesn’t sound unreasonable, and happily avoids the sensationalism of many other media-grabbing forecasts.


Median sales prices are generalities and not exact measurements of changes in fair market value. They can be affected by a number of factors and are sometimes subject to anomalous fluctuations. How they apply to any particular home is unknown without a specific comparative market analysis.


Economic Factors Affecting Real Estate Markets


Santa Clara County Real Estate
December 2019 Market SnapshotsBay Area Home Prices & Market Sizes


Estimated Percentage Appreciation Since 2012 - Most Expensive Markets, Peninsula/Silicon Valley
This next chart looks at percentage appreciation since 2012 in the most expensive cities of Santa Clara & San Mateo Counties. This graph does not delineate prices, which vary hugely, only estimated percentage home price changes over time. According to the calculations of this algorithm, the most recent peak in median home values occurred in the first half of 2018. 
Bay Area Markets for Homes of $5 Million+

Market Seasonality: New Listings Coming on Market
The market is now deep into its seasonal plunge in activity, which hits its nadir in December.

Estimated Median Home Price Trends by City since 1996
The following charts reflect estimated calculations of median home price trends since 1996 by an algorithm created for that purpose. As always, these numbers should be considered very general approximations of prices in complex markets containing homes of widely varying size and quality. 


Average Days on Market - County & City


Average Sales Price to Original List Price % - County & City


Percentage of Listings Accepting Offers by City

Price Reductions by Month - Santa Clara County


Santa Clara County Real Estate
Home Prices by City; Short-Term & Long-Term Appreciation Trends; Migration In & Out of the County; Price Reductions; Luxury Home SalesSeptember 2019 Report
After the heat of the spring market, activity typically slows down markedly in July and August. In September, listings start pouring on the market again to fuel the relatively short autumn selling season. What occurs in the next 2+ months, before the mid-winter holiday doldrums begin, will be the next major indicator of market conditions and direction.
City Home Prices & Appreciation Trends
In the tables and charts following, the city of San Jose is considered separately since some of its neighborhood markets are larger than most of the other county city markets.
Comparing 2019 YTD to 2018, all but one of the markets charted below saw some decline in median home sales prices, which parallels the situation for the county as a whole. Note that these declines typically followed very large price jumps 2017 to 2018.


San Jose Neighborhood Prices & Appreciation Trends


Migration: People Moving In & Out of Santa Clara County
Using new U.S. Census estimates released 8/29/19, this chart attempts to identify U.S. counties, states and international regions with the highest number of residents migrating to and from our county. In the Bay Area, there is a general trend outward from more expensive to more affordable places, while in-bound migration is deeply affected not only by exchanges between Bay Area counties, but people arriving from other parts of the state, country and world. Areas often have large two-way exchanges of residents, such as between Santa Clara and Alameda & San Mateo Counties.Foreign in-migration is a huge issue in the county and Bay Area, but it will be another year before any impact of new U.S. immigration policy on foreign in-migration in 2018 shows up in census numbers.The census estimates foreign in-migration in this analysis, but not foreign out-migration. 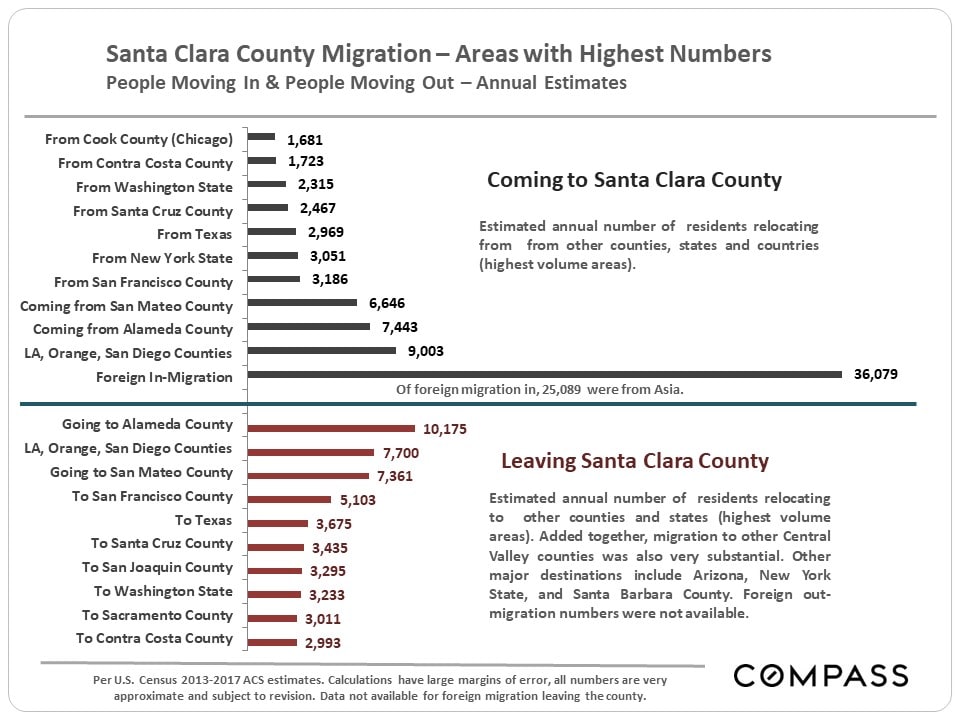
The chart below compares supply, the number of active listings on the market, with demand, as measured by the number of sales. This is a seasonally adjusted graph that smooths out normal monthly fluctuations to provide clearer historical trend lines. As context, the data below begins in 2013, after the market recovery was already well underway. If the data went back to the 2009 – 2011 period, during the post-crash market recession, the divergence between the two lines would be much, much greater than at any time illustrated here.

Short-Term & Long-Term Trends in Median Home Values


Selected Market Indicators
The chart below compares supply, the number of active listings on the market, with demand, as measured by the number of sales. This is a seasonally adjusted graph that smooths out normal monthly fluctuations to provide clearer historical trend lines. As context, the data below begins in 2013, after the market recovery was already well underway. If the data went back to the 2009 – 2011 period, during the post-crash market recession, the divergence between the two lines would be much, much greater than at any time illustrated here.It would be hard to come up with a more dramatic illustration for what occurred in the Santa Clara County market in the second half of 2017 through the first half of 2018.

County Trends in Price Reductions
The percentage of active listings undergoing price reductions spiked in mid-2018 and has remained elevated since then. The big factor behind the spike was that the late 2017/ spring 2018 market was extremely hot, with year-over-year appreciation rates and home prices jumping. When the market began to cool off, sellers and listing agents – relying upon recent sales data to set new listing prices – were wrong-footed by the significant softening in supply and demand dynamics. Sometimes, it takes a while to adjust pricing to changing market realities.

Bay Area Luxury Home Sales
Santa Clara remains by far the largest market for luxury home sales in the Bay Area, though San Mateo leads in the market for homes selling for $5 million and above. 

Santa Clara County Real Estate
Home Sales & Values by City and Price Segment, Market Seasonality, Luxury Home Sales, Market Dynamics by City, Foreign HomebuyersAugust 2019 Report

Note that it is not unusual for median sales prices to peak for the year in Q2.

Home Sales by Price Range

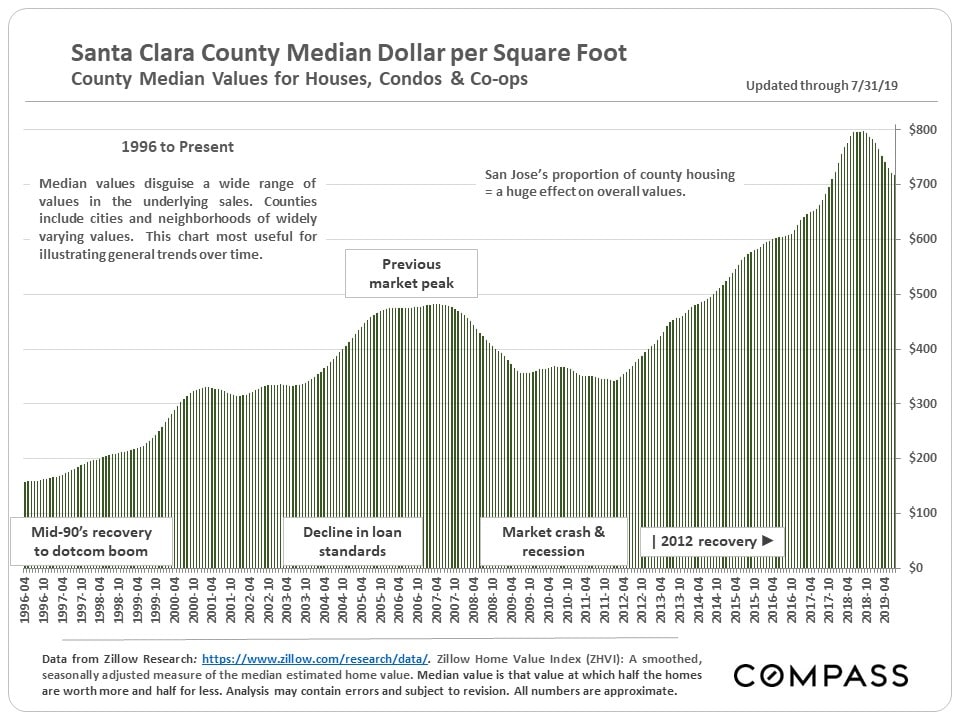
Average Dollar per Square Foot Values


Market Seasonality
After spring, activity usually slows down through the end of summer. Autumn is a relatively short selling season running from Labor Day through early-mid November. Activity then plunges for the winter holidays and doesn't wake up until late January or February. Of course, homes still sell in every season. 


Luxury Home Sales by City
There are 2 big clusters of luxury home sales in Santa Clara County: The first and largest is the Palo Alto - Los Altos - Los Altos Hills area, and the second is the Saratoga - Los Gatos/Monte Sereno area. 

Market Indicators by City
Two things should be kept in mind regarding the next 3 charts: 1) Q2 is often the highest demand market of the year, which will be reflected in the statistics illustrated, and 2) It is not unusual for higher price markets to have softer demand dynamics than more affordable areas, though that is not always the case.


Foreign National Home Buying Tumbles
According to a new report by the National Association of Realtors - based on a survey of its member agents - the purchase of U.S. homes by foreign nationals plunged in the 12 months through March 2019. The drop was particularly steep for Chinese nationals, for whom California has been the top destination.


Stock Market Hits New High
The last 12 months have been an extremely dramatic time for financial markets as illustrated below. The alternating confidence and fear generated by its swings have been considerable factors in real estate markets. A parallel dynamic has occurred with the swings in interest rates.

The Santa Clara County Real Estate Market
July 2019 ReportSanta Clara County saw a rebound in buyer demand, luxury home sales and in median home sales prices in Q2, assisted by stock markets hitting new peaks and interest rates falling to multi-year lows. However, its market remains distinctly cooler than the white-hot period running from late 2017 through mid-2018 - when it was perhaps the hottest metro market in the country, seeing stupendous year-over-year appreciation rates.
Median Home Sales Prices


Home Sales by Property Type & Bedroom Count

Luxury Home Sales
Within the Bay Area, Santa Clara County still has the highest number of home sales at prices of $3 million and above, but they are down from the peak sales volume hit in Q2 2018.

Selected Supply & Demand Statistics
In the next series of market trend charts, generally speaking, one can see the rebound in demand during the spring selling season, but also the general softening of the market that has occurred over the past year.


Overpricing: Negative Effects for Sellers & Opportunities for Buyers
We performed longer-term analyses of the effects of overpricing - as indicated by the need for price reductions before the property sold - on every major market in the Bay Area and the results were uniformly similar. As would be expected, there were dramatic differences in the sales price to list price percentage and time on market before sale. But there were also very substantial differences in the average dollar per square value realized upon sale.So, overpricing lowers values for sellers, which also signifies opportunities for buyers who keep an eye out for price reductions and react accordingly.

Mortgage Interest Rates Drop to Multi-Year Lows


Santa Clara County Real Estate
Buyer Demand Strengthens, Median Home Prices Rise, but Conditions Still Cooler & Prices Lower Than in White-Hot Market of Spring 2018June 2019 Market Report
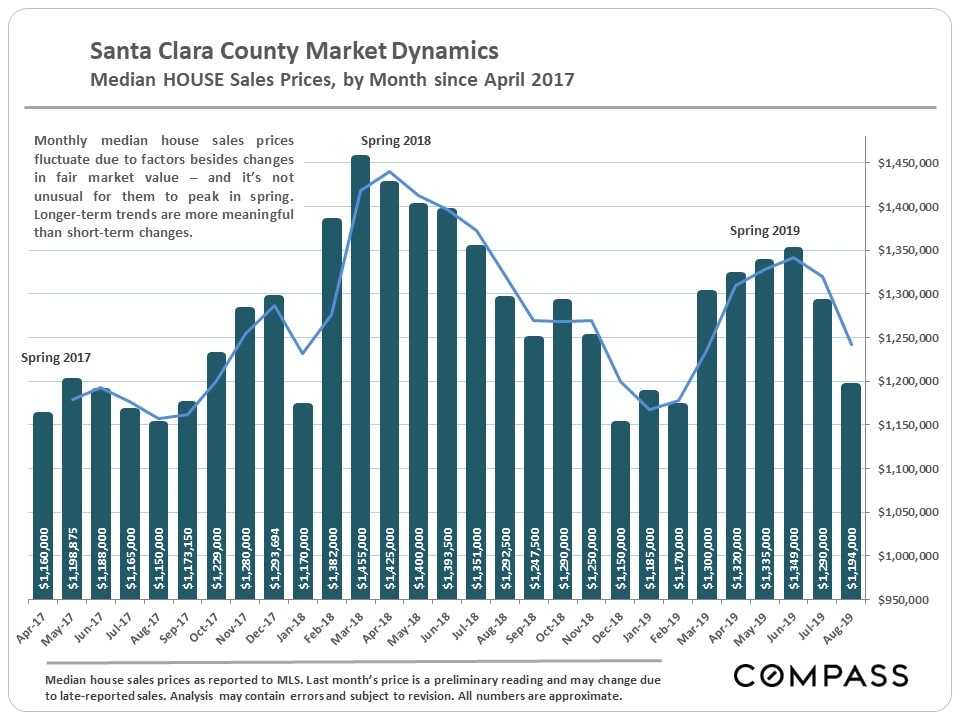
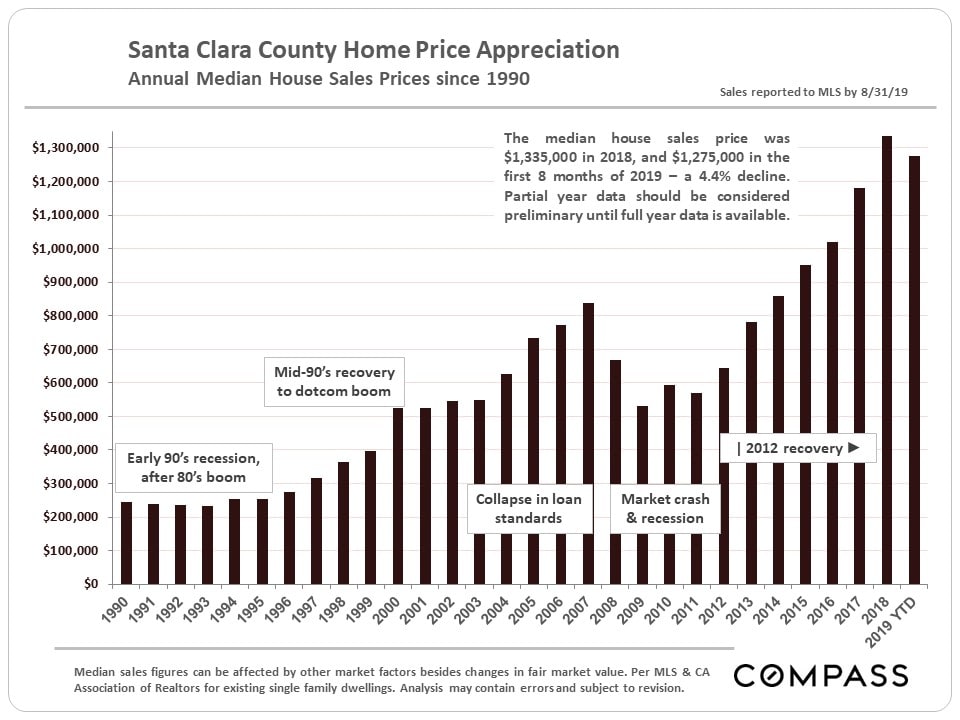
Median House Sales Prices Long-Term Trends

Year-Over-Year, March-May Comparisons

Santa Clara Luxury Home Sales
The luxury home market is fiercely seasonal with sales volume typically peaking in May or June - remember that one month's sales typically reflect accepted offers in the previous month. By any standard except a comparison with spring 2018's market, luxury home sales in spring 2019 have been strong - however, as referenced in the table above and the chart below, they are well down year over year. 
Median Home Price Changes in Selected County Markets
Comparing annual median home prices to partial year prices is not really an apples-to-apples comparison because of the effect of market seasonality on sales prices, but the below analysis is still an interesting indicator: In almost all of the markets below, year-to-date prices have ticked down. However, full-year 2019 median home prices may be significantly different than the year-to-date figures.


Median House Sales Prices by City & Bedroom Count


Click on the link below to go to our updated map of Bay Area median house prices.
Selected Market Indicators


Selected Economic & Demographic Snapshots
This next chart graphs unemployment rates from 1990 through January 2019. By April 2019, they had typically fallen another half percentage point. 

Of Bay Area counties, Santa Clara has the lowest percentage of 1-person households and the highest percentage of households with 4 or more residents.

Santa Clara County Real Estate
May 2019 ReportWith April’s end, we now have 2 months of spring selling season data unaffected by market activity at the end of 2018, when financial markets plunged. As of early May 2019, stock markets have recovered to hit new highs, and interest rates are far lower than last year’s peak. However, so far, neither median sales prices nor the level of market activity have returned to the peaks seen during the ferociously hot market of spring 2018.
Monthly Median House Sales Prices - Two Years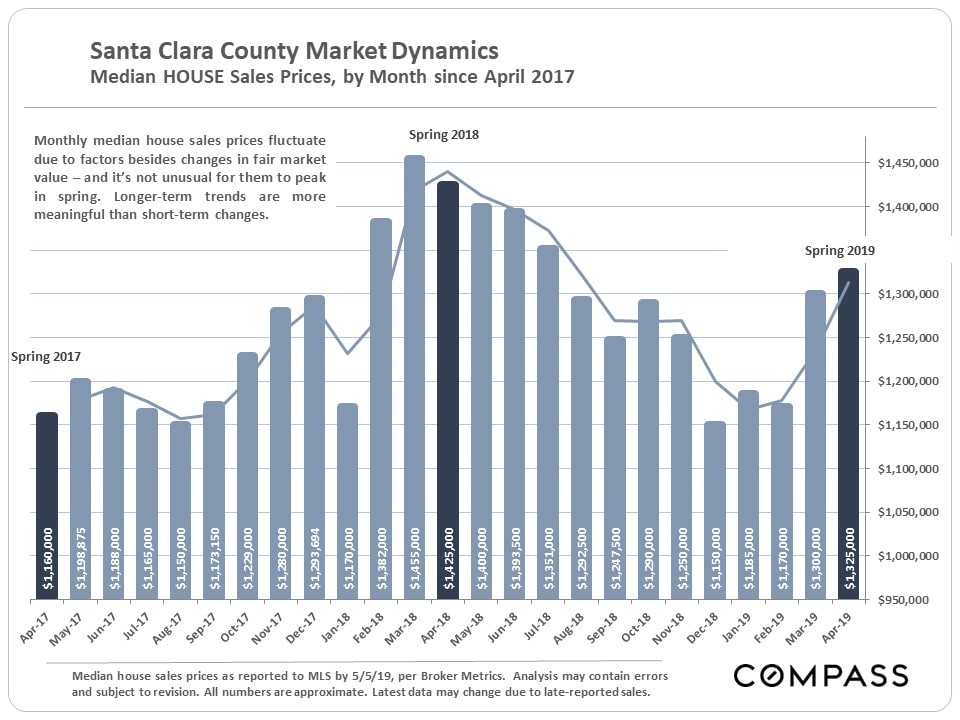
A look back at longer-term trends in year-over-year, median house sales price appreciation rates.
 This table compares the March-April market statistics of 2018 and 2019. By virtually every measure, the beginning of this year's spring market is considerably less intense than last year's.

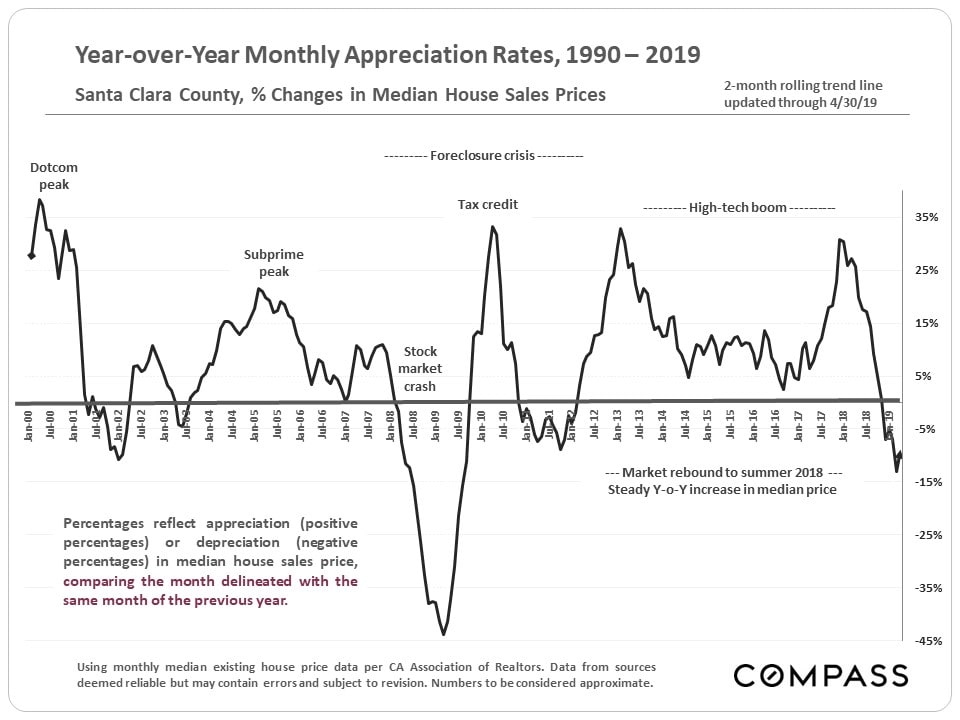
Year-over-Year, Monthly Median Home Price Appreciation Rates since 1990
A look back at longer-term trends in year-over-year, median house sales price appreciation rates.

Home Sales by Price Segment & Bedroom Count
An illustration of the last 12 months of house, townhouse, and condo sales broke out by price range and number of bedrooms. These are spread among a large number of very different markets within the county.
Home Sales, Sizes and Values by City
San Jose, of course, is the giant market in the county, but in the next chart we break out some of its individual neighborhoods instead.Below is an illustration of the number of house sales over the past 12 months, the median house sales price, median square footage and median bedroom/ bathroom count for each market. 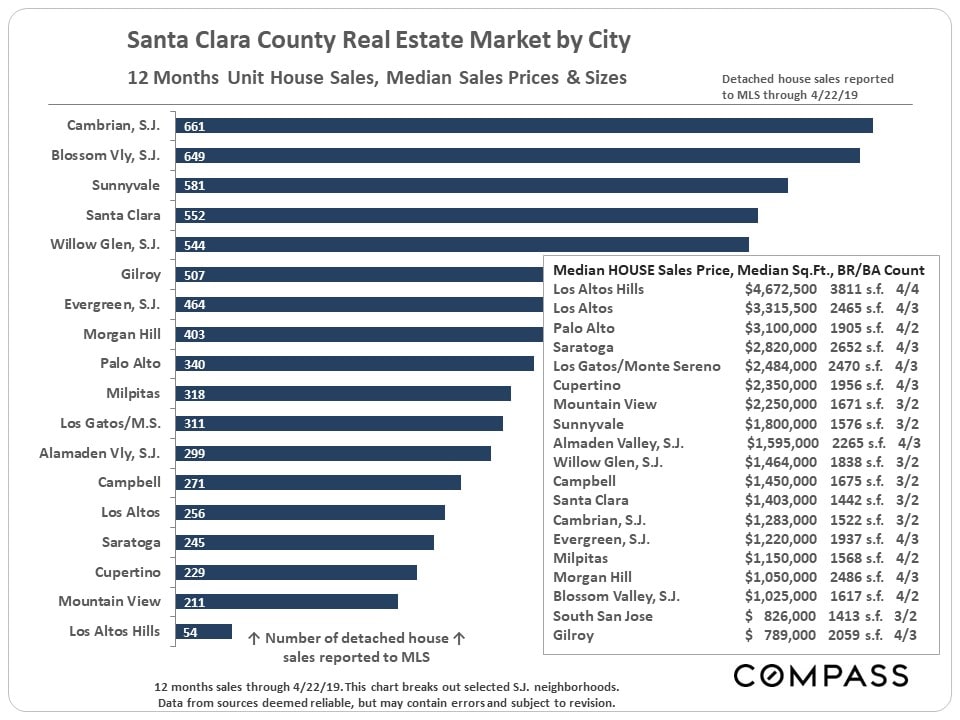 A look specifically at 2-bedroom/ 2 bath condo sales, median sales prices, and median unit square footage by market.
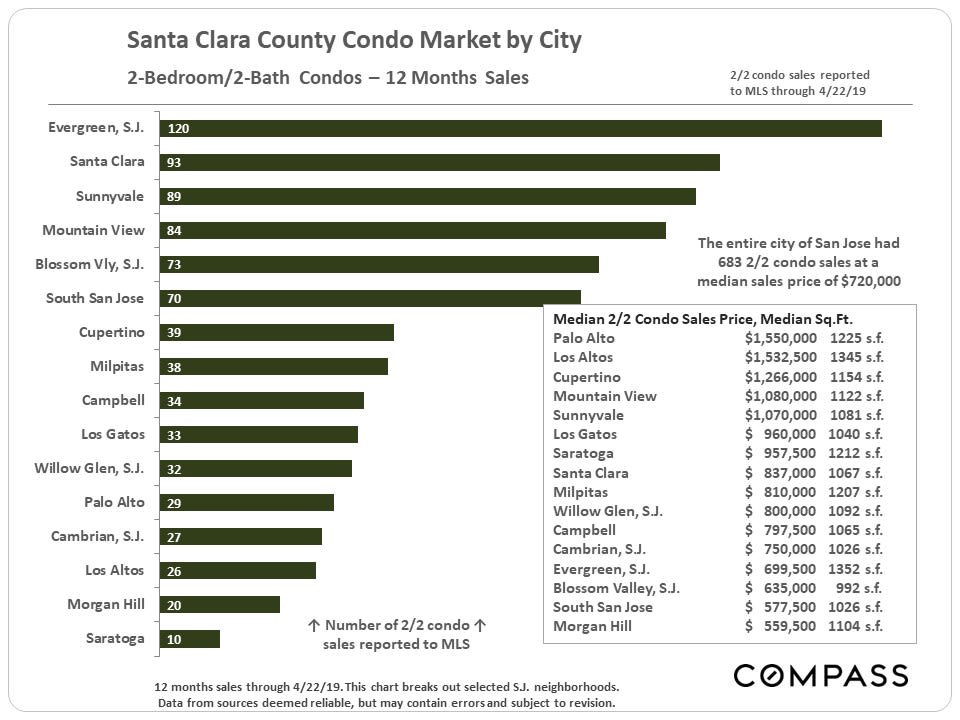
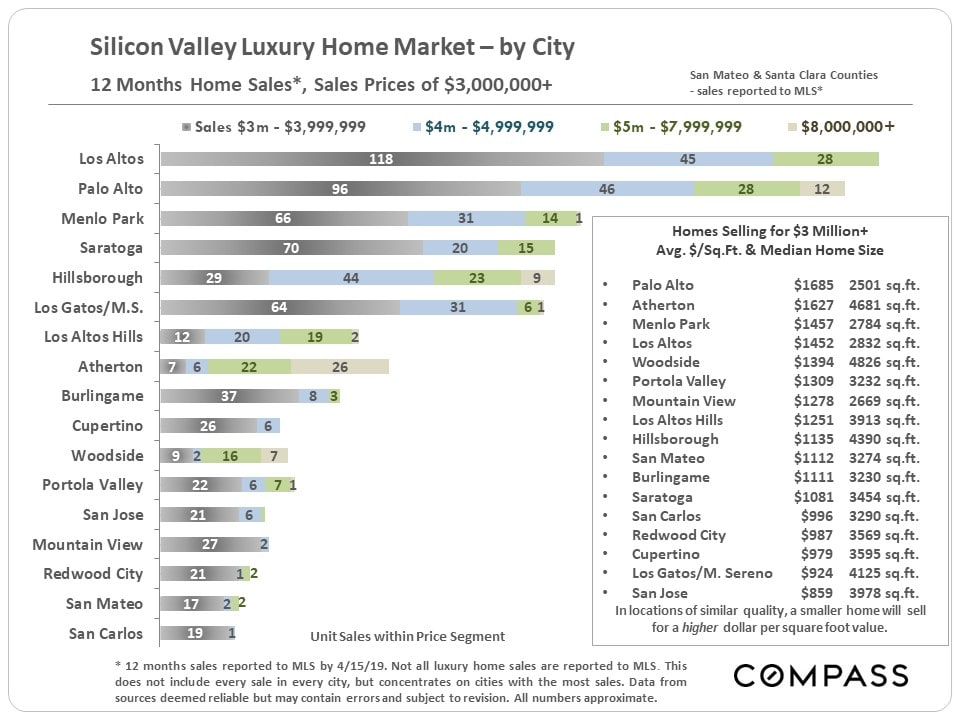
Sales Volumes, Values and Sizes by City - Santa Clara & San Mateo Counties


Luxury Homes Markets
Sales Volumes, Values and Sizes by City - Santa Clara & San Mateo CountiesWe typically define the luxury home threshold at sales prices of $3,000,000 and above. Of course, what one gets for that price varies enormously in different locations. Silicon Valley has the largest luxury home market in California.
The "ultra-luxury" segment begins at sales prices of $5 million. Below is a snapshot of Q1 2019 statistics in Santa Clara County, illustrating a somewhat soft dynamic of relatively high inventory as compared to the rate of sales. Note the differential between median list prices, sales prices, and the median price of those listings that expired without selling.

Q1 2019 Ultra-Luxury Market, Santa Clara County
The "ultra-luxury" segment begins at sales prices of $5 million. Below is a snapshot of Q1 2019 statistics in Santa Clara County, illustrating a somewhat soft dynamic of relatively high inventory as compared to the rate of sales. Note the differential between median list prices, sales prices, and the median price of those listings that expired without selling.Q2 is typically the biggest quarter of the year for high-price home sales. 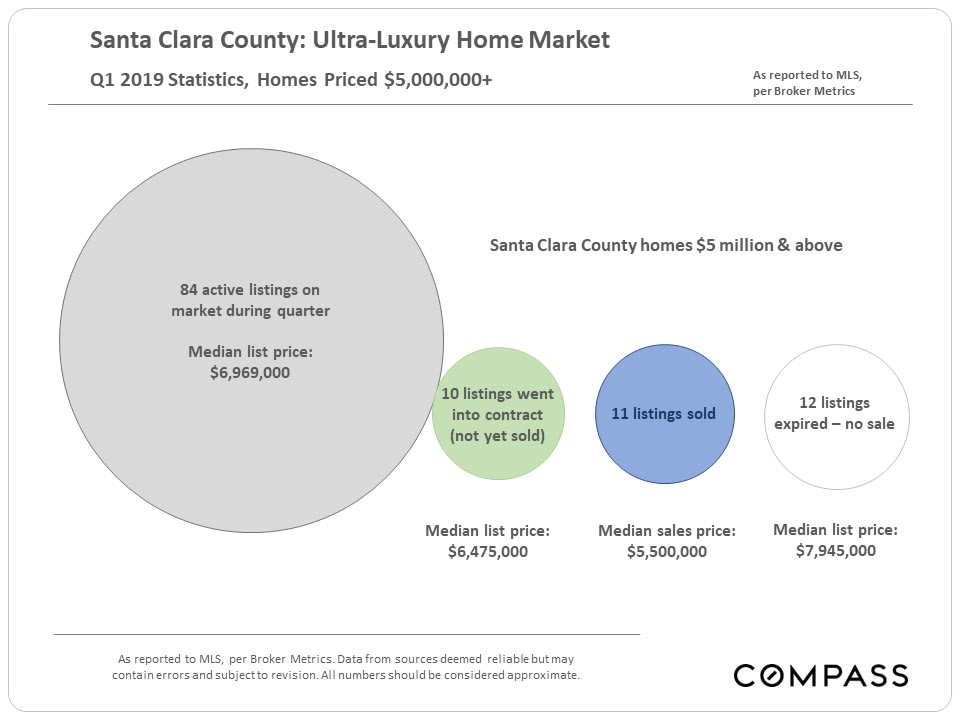
Many factors influence home construction during any particular period: Affluence, economic conditions (high-tech booms), household size, buyer age, land costs, population growth, highway construction, natural disasters, etc. Generally speaking, the median size of Santa Clara County houses built in the first half of the 20th century was smaller, but then started to increase rapidly until hitting a new peak since 2000. This overall trend coincided with the population explosion that began in the 1940s.

Median House Size & Era of Construction
Many factors influence home construction during any particular period: Affluence, economic conditions (high-tech booms), household size, buyer age, land costs, population growth, highway construction, natural disasters, etc. Generally speaking, the median size of Santa Clara County houses built in the first half of the 20th century was smaller, but then started to increase rapidly until hitting a new peak since 2000. This overall trend coincided with the population explosion that began in the 1940s.Over the past few decades, condos - built in increasing numbers - have become a major alternative for people purchasing homes of smaller size.

Selected Demographic & Economic Factors
Population GrowthNew census figures have just been released: The latest surge in county population began 10 years ago with big increases through 2016, increases which paralleled the tremendous jump in high-tech hiring. However, in the last 2 years through mid-2018, annual growth figures began to markedly slow.


Commuting

Venture Capital Flow
In recent years, the Bay Area has been the biggest destination of venture capital investment dollars in the country - and probably the world. These tens of billions of dollars have constituted a massive factor in the local economy, supercharging the creation of new companies, hiring, and, eventually, IPOs. Ultimately, venture capital is seed money that in the last decade has exploded into the creation of stupendous amounts of new wealth. 
It is impossible to know how median and average value statistics apply to any particular home without a specific comparative market analysis. These analyses were made in good faith with data from sources deemed reliable, but may contain errors and are subject to revision. It is not our intent to convince you of a particular position, but to attempt to provide straightforward data and analysis, so you can make your own informed decisions. Median and average statistics are enormous generalities: There are hundreds of different markets in San Francisco and the Bay Area, each with its own unique dynamics. Median prices and average dollar per square foot values can be and often are affected by other factors besides changes in fair market value. Longer term trends are much more meaningful than short-term.
Compass is a real estate broker licensed by the State of California, DRE 01527235. Equal Housing Opportunity. This report has been prepared solely for information purposes. The information herein is based on or derived from information generally available to the public and/or from sources believed to be reliable. No representation or warranty can be given with respect to the accuracy or completeness of the information. Compass disclaims any and all liability relating to this report, including without limitation any express or implied representations or warranties for statements contained in, and omissions from, the report. Nothing contained herein is intended to be or should be read as any regulatory, legal, tax, accounting or other advice and Compass does not provide such advice. All opinions are subject to change without notice. Compass makes no representation regarding the accuracy of any statements regarding any references to the laws, statutes or regulations of any state are those of the author(s). Past performance is no guarantee of future results.

Home Prices, Sales & Statistics; Stock Markets; Interest Rates and Unicorns

Santa Clara County Real Estate
Home Prices, Sales & Statistics; Stock Markets; Interest Rates and UnicornsApril 2019, Q1 Report
A substantial portion of Q1 statistics reflect new listings and accepted offers occurring during the mid-winter market doldrums (Thanksgiving to mid-January). In November and December 2018, the stock market plunged drastically from its all-time high in September, and interest rates hit their highest point in years: These factors negatively affected buyer demand. Then both turned in dramatically positive directions in early 2019. So, Q1 statistics reflect economic conditions in both Q4 2018 (very negative) and Q1 2019 (very positive). It is also the quarter with the lowest sales volume.
The spring selling season - whose data starts to show up in March, but is mostly reflected in Q2 - is the most active of the year. As always, there are many economic factors at play impacting Bay Area markets, some of which are discussed below.
Year-Over-Year & Long-Term Trends
Santa Clara County may have been the hottest major market in the country from the second half of 2017 through the first half of 2018. However, since then, its market has cooled the most of all the Bay Area counties. 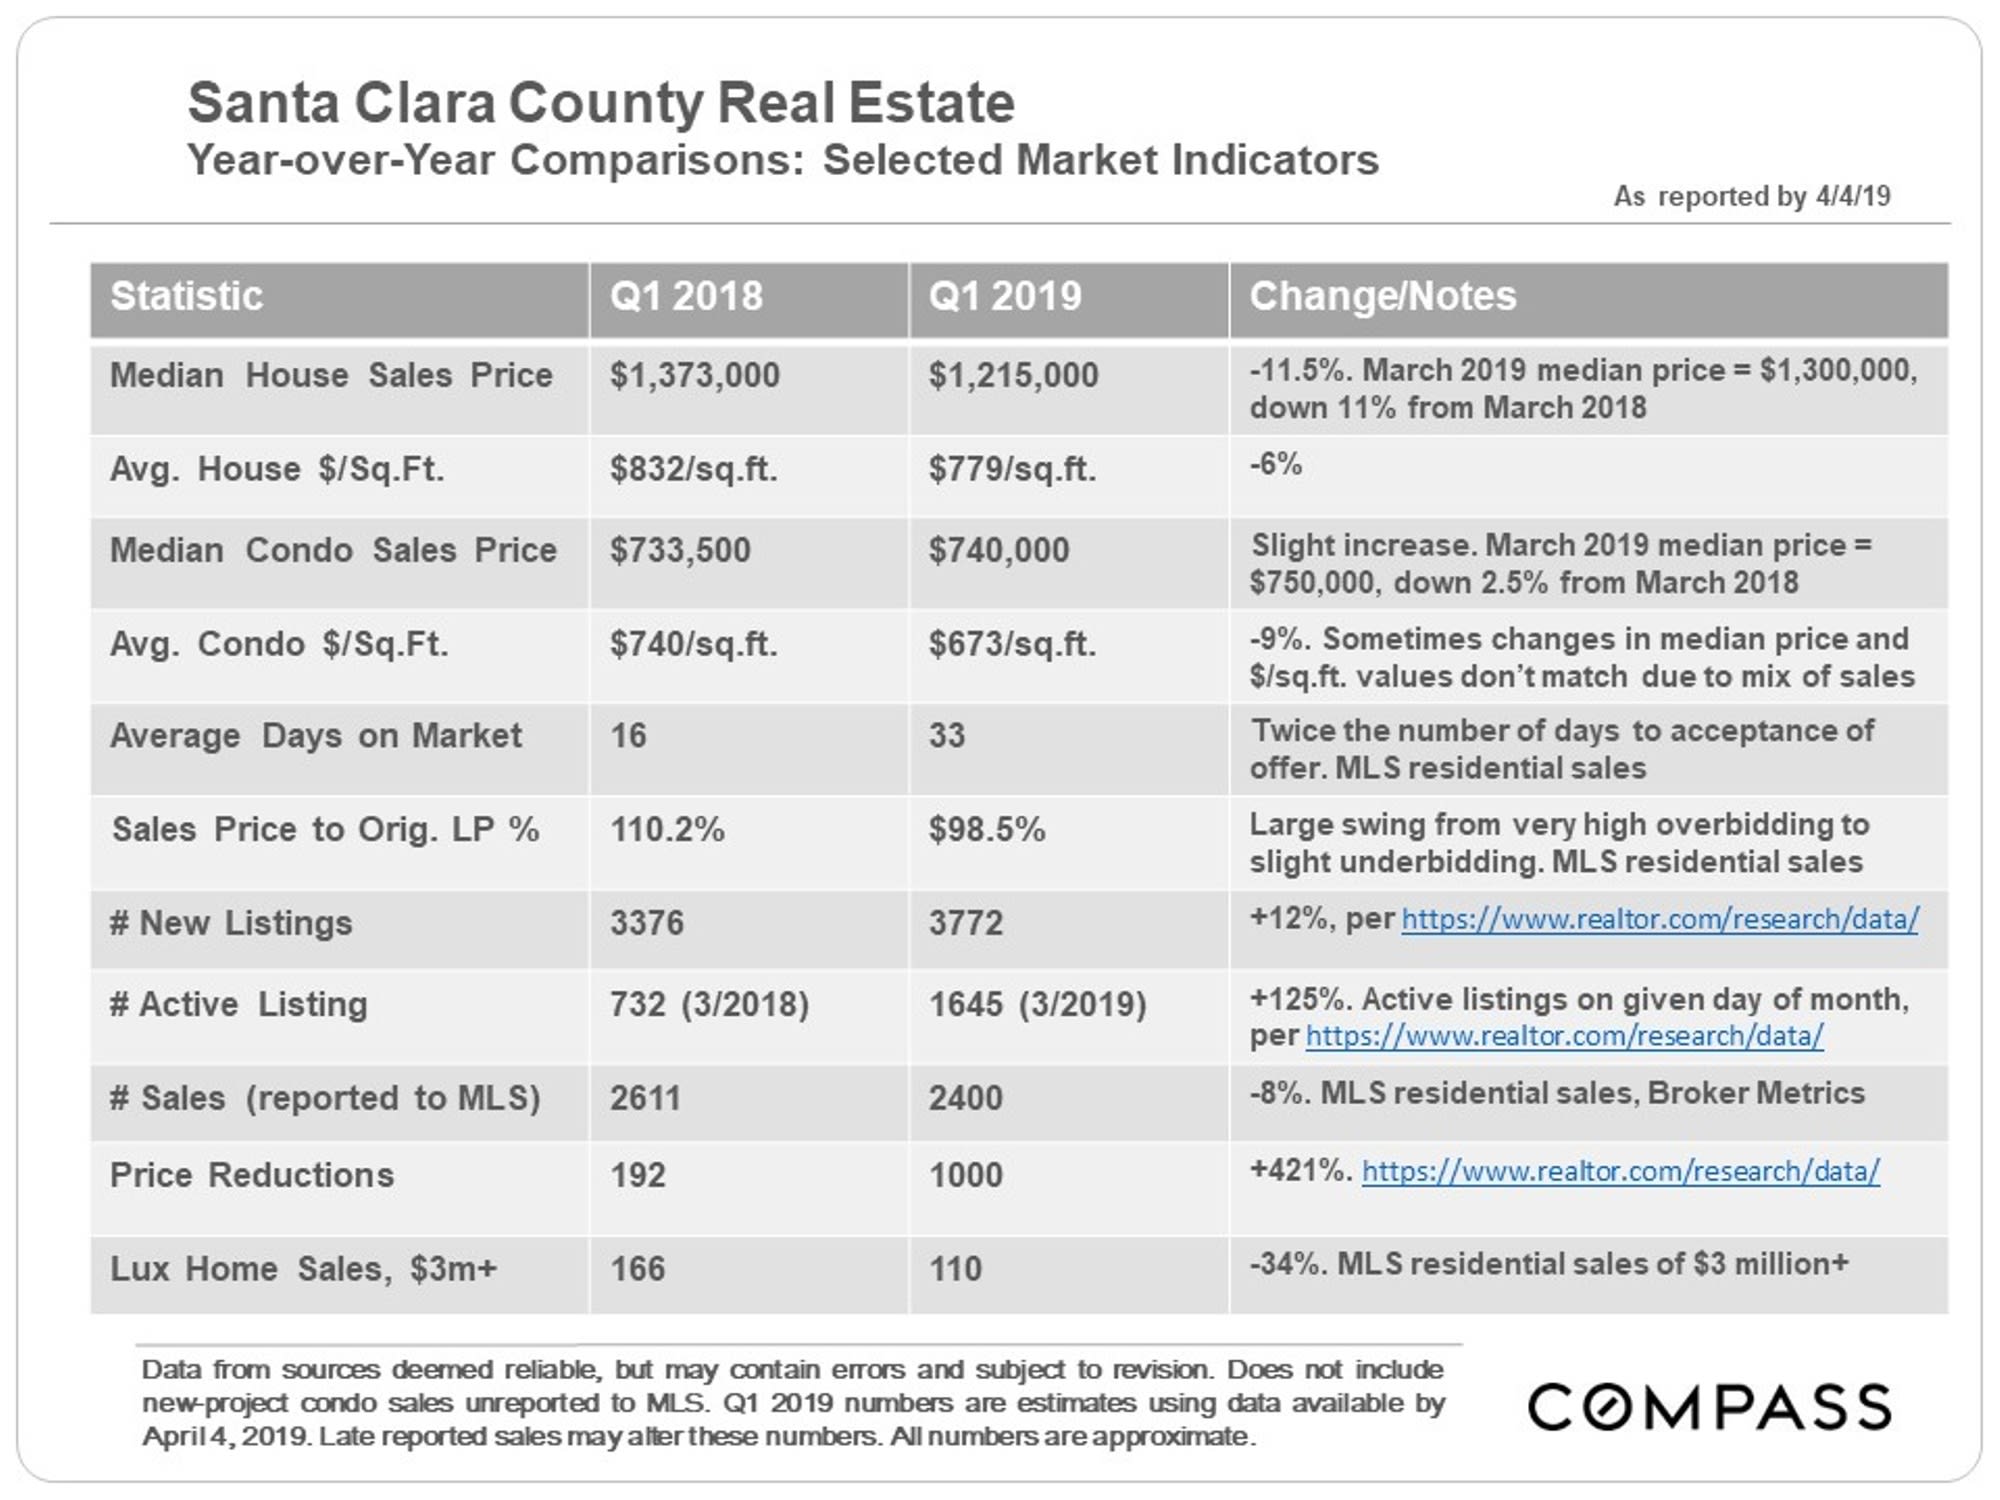

Median Sales Price Trends
Long-Term Trend by Month

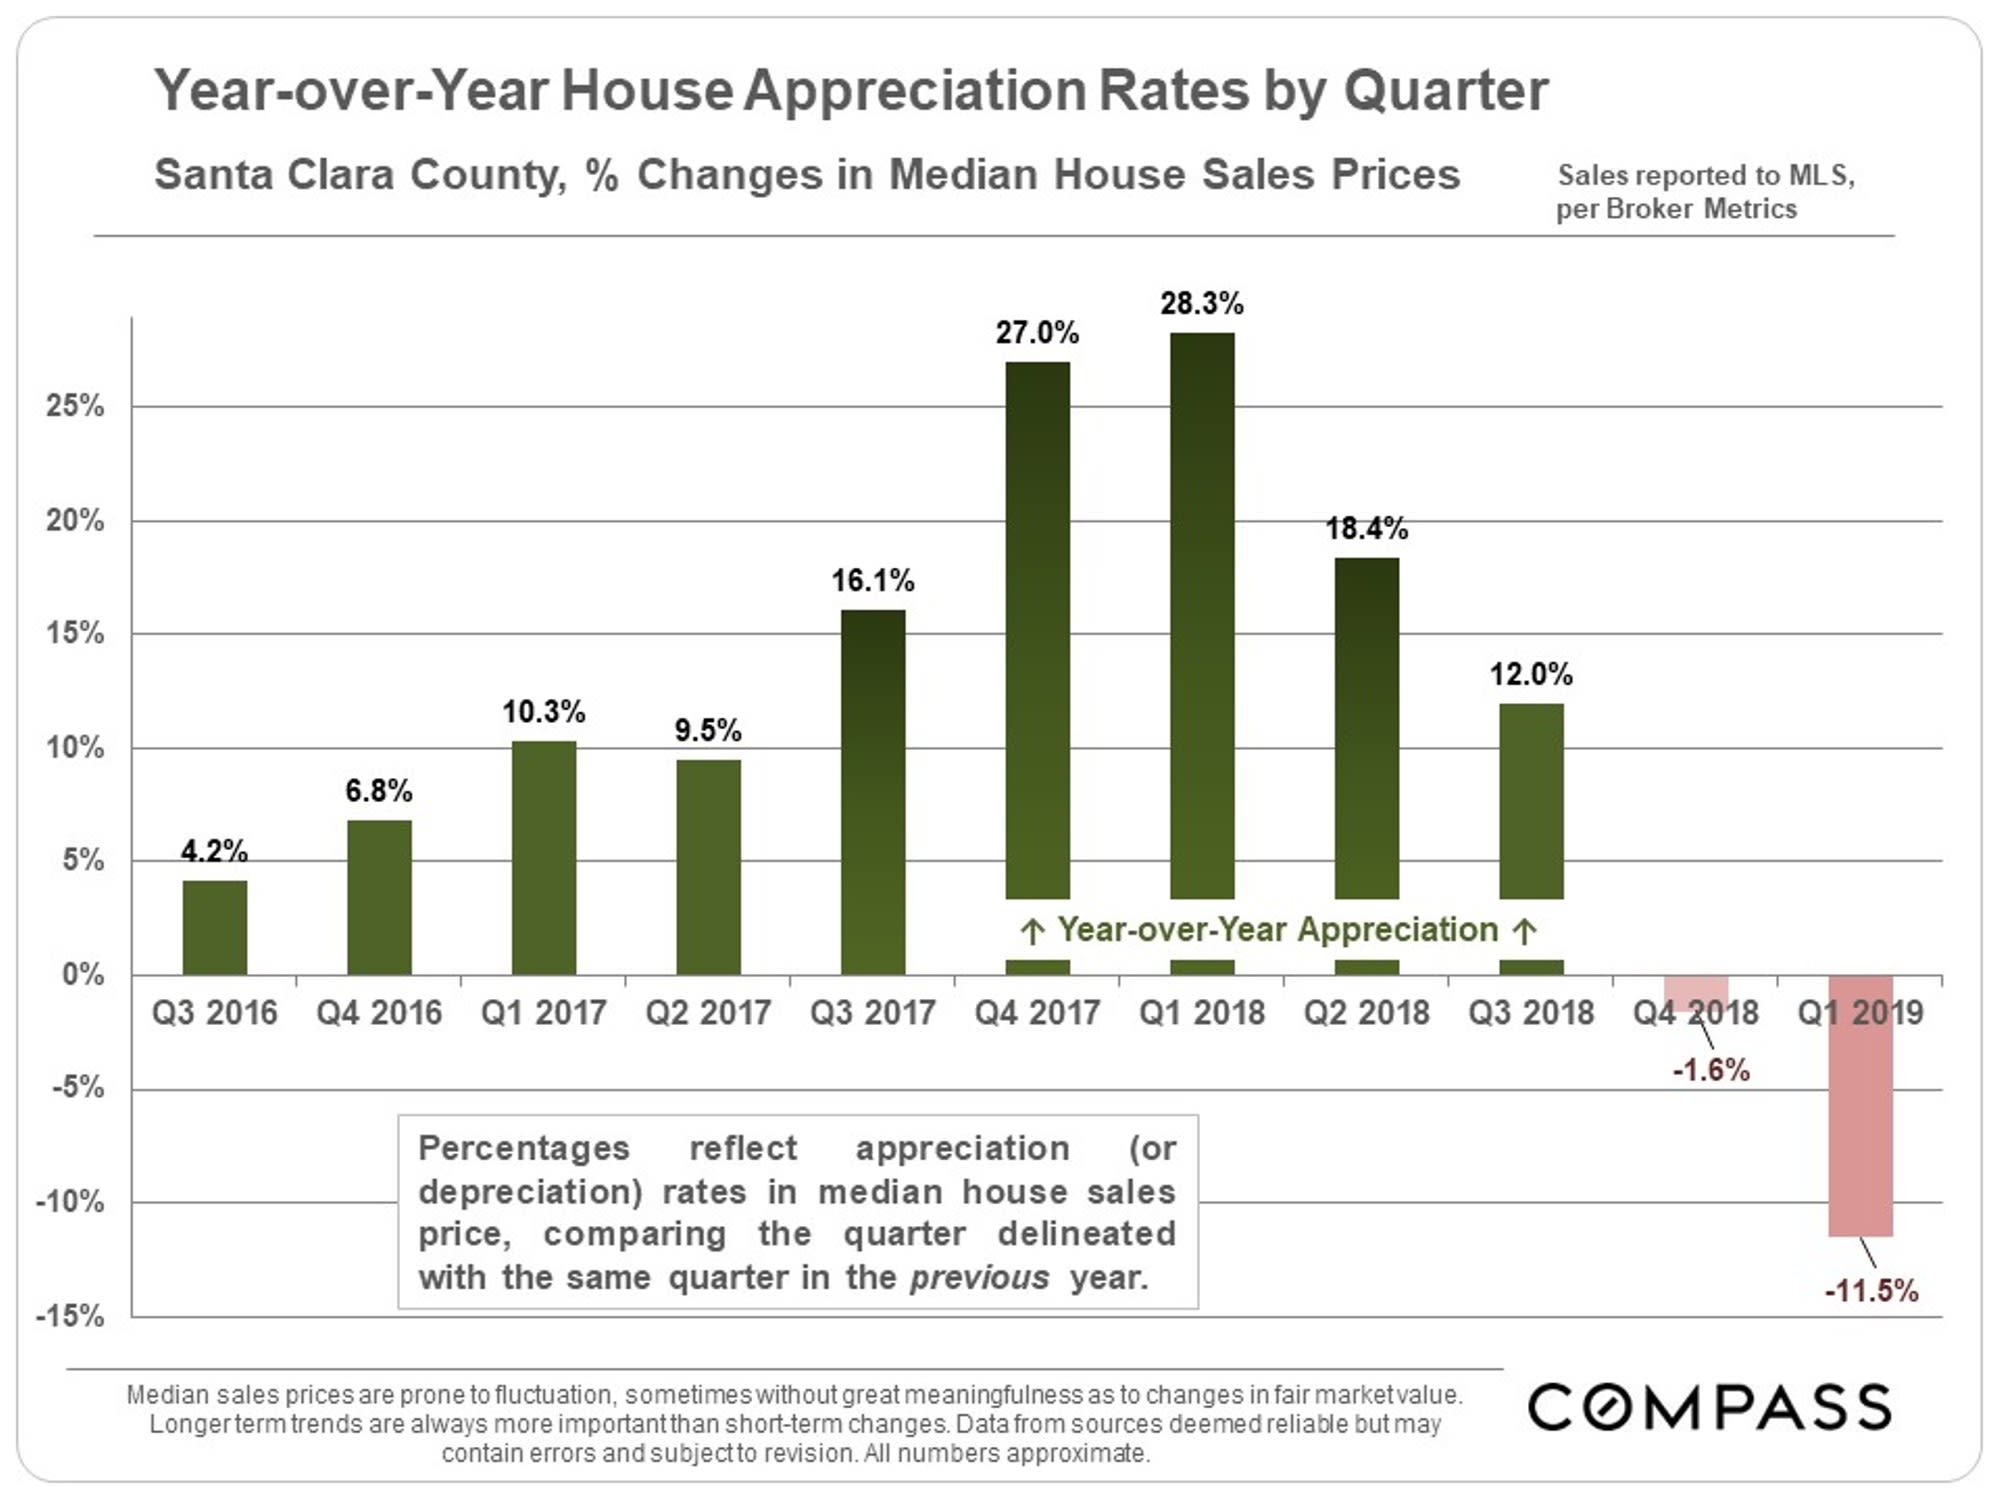
Shorter-Term Trend by Quarter


Quarterly year-over-year median house sales price appreciation rates went from 28.3% in Q1 2018 (over Q1 2017) - an incredibly high rate - to a negative, 11.5% decline in Q1 2019 (compared to Q1 2018). What occurs in Q2, just started and usually, the most active selling season of the year will be critical as to market direction.

Active Listings on the Market
This chart gives greater context to the increase of listings on the market than the simple year-over-year comparison. Inventory last year was extremely low and has jumped dramatically since then. But, historically speaking, the number of active listings is not wildly high.
Luxury Home Sales
Sales of homes of $3 million and above have dropped considerably, but part of that may be due to the financial market volatility in Q4 2018. Last year, Q2 saw a very large burst in sales.
Sales Price to Original List Price Percentage

Average Days on Market

Selected Economic Factors
A gigantic factor underlying Bay Area housing markets has been the staggering increase in employed residents since 2010. Outward-bound migration trends of residents and businesses - often citing housing costs as one major motivator - have been an increasing concern in recent years, but for the time being, employment numbers have continued to grow.
A new surge of large, high-tech unicorn IPOs - mostly of firms headquartered in SF - has just started to roll out. IPOs have historically created vast quantities of new wealth in the Bay Area, though the magnitude of the effect of this new wave on our local housing market may be minimal due to our distance from SF. (Though there have been suggestions that Palantir in Palo Alto may go public in 2019.)


Housing Affordability & Household Incomes
This chart calculates the income required to buy a median-priced house in Q4 2018. Median condo prices are substantially less in every county and would require lower incomes.

Health & Economic Indicators
According to CountyHealthRankings.org, Bay Area counties are at the top of the list within CA for Overall Health Outcomes: Marin, San Mateo and Santa Clara rank 1, 2 & 3 respectively. Santa Clara ranks first for positive health behaviors.