

Marin County Real Estate
January 2020 ReportGenerally speaking, after years of high appreciation rates, annual 2019 Bay Area median home prices went down a little bit, went up a little bit, or basically remained unchanged as compared to 2018. Marin is one of the markets that ticked down, though the message is more mixed when looking at individual city price trends.
For 2020, economist Ken Rosen at UC Berkeley has said he expects the Bay Area median price to remain basically flat, within a general range of up or down 2% - in other words, similar to what happened last year. We can’t predict the future, but that doesn’t sound unreasonable, and happily avoids the sensationalism of many other media-grabbing forecasts.


How median prices apply to any particular home is unknown without a specific comparative market analysis.


Economic Factors Affecting Real Estate Markets


Marin County Real Estate
December 2019 Market SnapshotsBay Area Home Prices & Market Sizes


Bay Area Markets for Homes of $5 Million+
Marin is one of the smallest county markets in the Bay Area by a total number of sales (pie chart above) but ranks 4th in the number of $5,000,000+ homes sold (blue columns). 
Estimated Median Home Value Trends since 1996
According to the calculations of an algorithm created for this purpose, median home values are generally down from recent peaks. (Sausalito and Greenbrae are not included because either this data source does not include the market, or due to data reliability issues.)


Median Home Size & Dollar per Square Foot Value


Days on Market - County & City


Months Supply of Inventory - County & City


Average Sales Price to Original List Price %

Price Reductions


Marin County Real Estate


Marin County Real Estate
Home Prices by City; Short-Term & Long-Term Appreciation Trends; Migration In & Out of County; Price Reductions; Unsold InventorySeptember 2019 Report
After the heat of the spring market, activity typically slows down markedly in July and August. In September, listings start coming on the market to fuel the relatively short autumn selling season. What occurs in the next 2+ months will be the next major indicator of market conditions and direction.
Home Prices by City
Some of the city markets delineated below have few sales, especially in a specific home size: A blank field indicates insufficient data. A house with more bedrooms is not necessarily larger than one with less, and the size and quality of homes of identical bedroom counts vary enormously. Many factors affect sales prices besides neighborhood/ bedroom count: quality of location within the neighborhood, condition, size, architecture, views, amenities, parking, outdoor space, etc. Median prices should always be considered generalities. 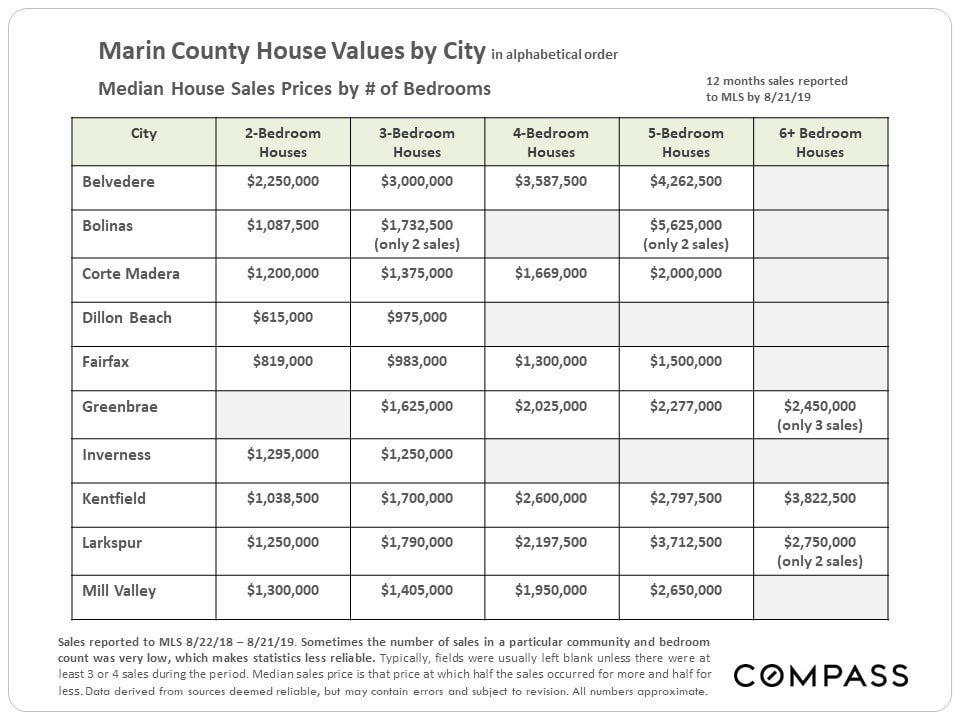
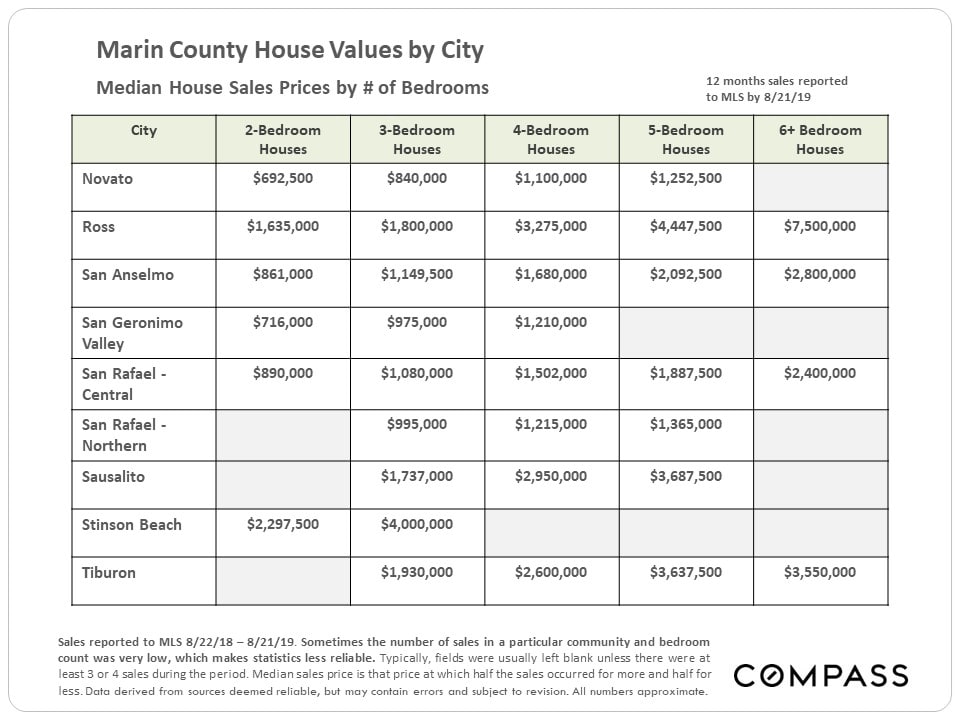
As seen below, with 2019 YTD median house prices, some Marin cities are a bit up from 2018, some a bit down, and a couple basically flat. The problem with Marin is that many of its communities don't have that many sales - especially true of some of the county's most expensive markets - which can lead to anomalous fluctuations in median prices. Full-year 2019 median prices may well be different than those for the first 8 months.


Home Price Appreciation since 2011 - for Selected Marin Cities
As seen below, with 2019 YTD median house prices, some Marin cities are a bit up from 2018, some a bit down, and a couple basically flat. The problem with Marin is that many of its communities don't have that many sales - especially true of some of the county's most expensive markets - which can lead to anomalous fluctuations in median prices. Full-year 2019 median prices may well be different than those for the first 8 months.


Migration In & Out of County
Using new U.S. Census estimates released 8/29/19, this chart attempts to identify U.S. counties, states, and international regions with the highest number of residents migrating to and from our county. In the Bay Area, there is a general trend outward from more expensive to more affordable places, while inbound migration is deeply affected not only by exchanges between Bay Area counties, but people arriving from other parts of the state, country, and world. Areas often have large two-way exchanges of residents, as between Marin and Sonoma, and Marin and San Francisco.
Foreign in-migration is a big issue in the Bay Area, but it will be another year before any impact of new U.S. immigration policy on foreign in-migration in 2018 shows up in census numbers. In the last census estimate, Europeans made up the largest share of foreign immigrants to Marin. 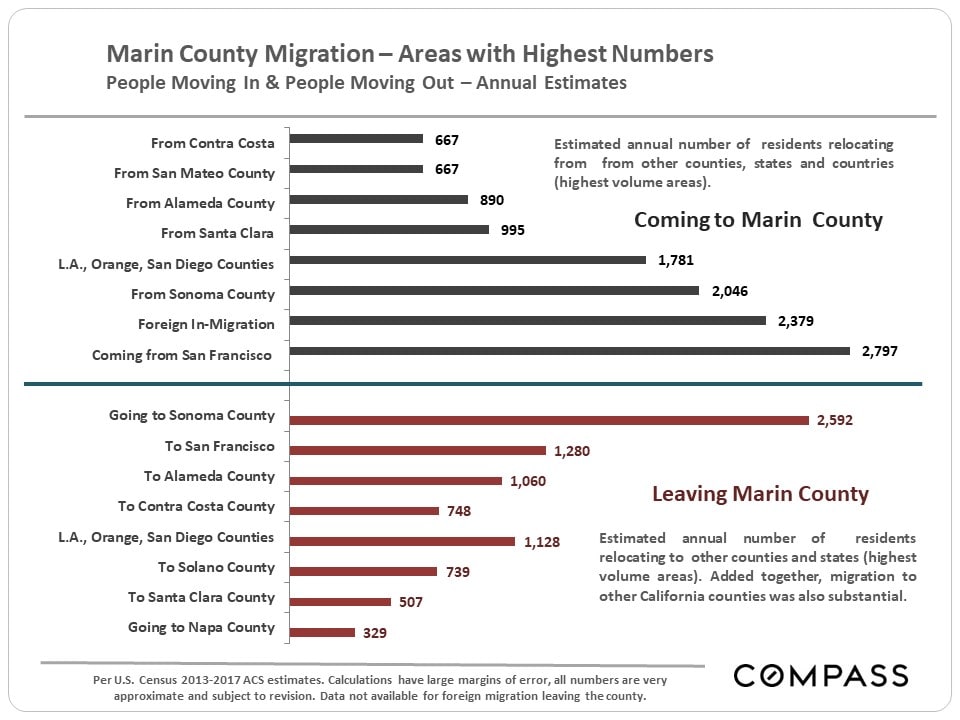

Short-Term & Long-Term Trends in Median Home Values

For the county as a whole, year-to-date median home values have ticked down a little. Again, this should be considered preliminary until full-year data is available.


Selected Market Statistics
The chart below compares supply, the number of active listings on the market, with demand, as measured by the number of sales. This is a seasonally adjusted graph that smooths out normal monthly fluctuations to provide clearer historical trend lines. As context, the data below begins in 2013, after the market recovery was already well underway. If the data went back to the 2009 – 2011 period, during the post-crash market recession, the divergence between the two lines would be much, much greater than at any time illustrated here. (Note that the seasonally adjusted data on Marin monthly sales volume is still a few months behind.)
Generally speaking, the percentage of active listings undergoing price reductions spiked in mid-2018 and has remained somewhat elevated since then. The big factor behind the spike was that the late 2017/ early 2018 market was very hot. When the market began to cool off, sellers and listing agents – relying upon recent sales data to set new listing prices – were wrong-footed by the softening in supply and demand dynamics. Sometimes, it takes a while to adjust pricing to changing market realities.


Marin County Real Estate
Home Sales & Values by City and Price Segment, Market Seasonality, Luxury Home Sales, Market Dynamics by City, Foreign HomebuyersAugust 2019 Report

The May Case-Shiller Home Price Index was released in late July for the 5-county SF metro area. This chart illustrates the difference in appreciation rates between the Bay Area (higher price markets) and the entire country. Case-Shiller does not use median sales prices but its own algorithm to calculate appreciation. January 2000 home price = 100; 250 = a home price 150% above that of Jan. 2000.


Home Sales by Price Range

Market Seasonality
After the summer slowdown, new listings typically spike back up in September to fuel the relatively short autumn selling season. Come mid-November, activity begins to plunge for the mid-winter holidays. 

Luxury Home Sales

The luxury home market is even more fiercely seasonal than the general market in the ebbs and flows of its activity. September commonly sees a big surge in new listings. Many high-end listings that don't sell in autumn will be pulled off the market in late November and early December to wait for the activity to pick up again in February and March. 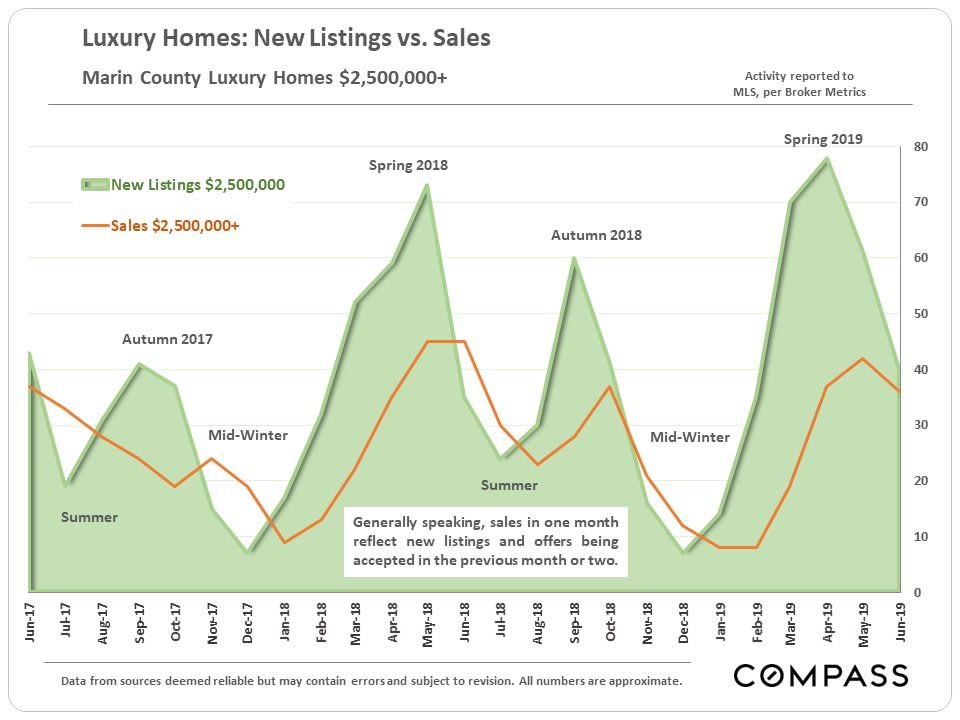
There are many factors at play in supply and demand, and it is not unusual for higher price markets to have softer buyer-demand dynamics than more affordable areas, though this is not always the case. Not only are there many fewer buyers for the most expensive homes, but, generally speaking, overpricing is a more common issue with such properties. Of course, in every city and every price segment, there are homes that sell very quickly, homes that go through price reductions, and homes that don't sell at all.

Market Indicators by City
There are many factors at play in supply and demand, and it is not unusual for higher price markets to have softer buyer-demand dynamics than more affordable areas, though this is not always the case. Not only are there many fewer buyers for the most expensive homes, but, generally speaking, overpricing is a more common issue with such properties. Of course, in every city and every price segment, there are homes that sell very quickly, homes that go through price reductions, and homes that don't sell at all.


Foreign National Home Buying Tumbles
According to a new report by the National Association of Realtors - based on a survey of its member agents - the purchase of U.S. homes by foreign nationals plunged in the 12 months through March 2019. California, and the Bay Area in particular, have been top destinations for international home buyers.

Stock Market Hits New High
The last 12 months have been an extremely dramatic time for financial markets as illustrated below. The confidence or fear generated by its swings has been a considerable factor in real estate markets. A parallel dynamic has occurred with the swings in interest rates. 
Market Statistics by Price Segment
To a significant degree, within county markets around the Bay Area, market dynamics often correlate better with price segment than with city location - though that is not always true.


Marin County Real Estate
Stock markets hit new peaks; interest rates hit multi-year lows; unicorn IPOs roll out in San Francisco; an active spring selling season in Marin with median home sales prices about the same year-over-year.July 2019, Q2 Market Report
Median Home Sales Price Trends


Home Sales by Property Type & Bedroom Count

Luxury Home Sales
Strong spring for the Marin luxury home market, but not quite as active as last year in Q2 2018.

Selected Indicators of Buyer Demand & Market Seasonality
In the next series of charts, 2 points generally stand out: Buyer demand considerably strengthened during the spring selling season as compared to the previous 2 quarters - which is a normal seasonal trend. And spring 2019 was not as competitive a market as spring 2018 - which was a common dynamic around the Bay Area (though San Francisco's market was quite feverish, probably due to all the local IPOs).


Overpricing: Negative Effects for Sellers & Opportunities for Buyers
We performed longer-term analyses of the effects of overpricing - as indicated by the need for price reductions before the property sold - on every major market in the Bay Area and the results were uniformly similar. As would be expected, there were dramatic differences in the sales price to list price percentage and time on market before sale. But there were also very substantial differences in the average dollar per square value realized upon sale. This is almost certainly due to missing out on the sales-price-enhancing effects of buyers competing for new listings they deem well priced.So, overpricing lowers values for sellers, which also signifies opportunities for buyers who keep an eye out for price reductions and react accordingly.

We not only mapped Bay Area median house sales prices but ranked them, lowest to highest. Unsurprisingly, certain Marin, San Mateo and Santa Clara cities, and various San Francisco neighborhoods dominate the upper end. If interested, click on the link below: The ranking list can be found below the map.
Mortgage Interest Rate Trends since 1981
2019 saw a stunning drop from late 2018 with a very significant effect on housing costs.

Marin County Real Estate
Spring Market Strengthens, But Dynamics Are Cooler Year-over-Year and Median Sales Prices Somewhat LowerJune 2019 Market Report
Long-Term Median Home Price Trends

March-May Market: Year-over-Year Comparisons
Some indications of year-over-year cooling from the very hot spring 2018 market, pretty much across the board. The median house sales price ticked down a bit. The larger decline for condos should be taken with a grain of salt due to the relatively low number of condo sales over the period.
Generally speaking, the changes are not very dramatic, and indeed some current statistics - such as the recent, still low, months-supply-of-inventory reading - would typically be considered to indicate a high-demand/ low-supply market.

Median Home Price Changes for Selected County Markets
Comparing annual median home prices to partial year prices is not really an apples-to-apples comparison because of the effect of market seasonality on sales prices - and year to date, some cities are up, some down and some are basically unchanged. It's hard to discern a definitive trend.
We chose the selection of cities below because they had higher numbers of sales than other communities while representing a range of price points. Still, in the first 5 months of 2019, Tiburon only had 26 house sales reported to MLS, a surprisingly low number. (Belvedere and Ross had even fewer, but they never have many sales.) Full-year 2019 median home prices may be significantly different than the year-to-date figures.


Median Home Sales Prices by City & Bedroom Count


Selected Market Indicators
Among other angles, these charts illustrate the dramatic effect that seasonality plays in market demand. Typically, the market will now begin slowing down for summer before picking up again during the relatively short autumn selling season. However, June sales data will mostly reflect May accepted offers, and will complete our picture of the second quarter, usually the most active of the year.Monthly Sales Volume

Marin Luxury Home Sales

Average Sales Price to Original List Price Percentage
Buyer competition for new listings as measured by this classic statistic of demand is down compared to the peaks reached in recent spring markets. 
Selected Economic & Demographic Snapshots
This next chart graphs Bay Area unemployment rates from 1990 through January 2019. By April 2019, they had typically fallen another half percentage point. Marin often has the lowest rate in the Bay Area. 


Marin County Real Estate
Year-over-Year, Spring Market is Cooler as Median House Sales Price Remains SteadyMay 2019 Report
With April’s end, we now have 2 months of spring season data unaffected by market activity at the end of 2018, when financial markets plunged. As of early May 2019, stock markets have recovered to hit new highs, interest rates are far lower than last year’s peak, and unicorn IPOs have begun to roll out after a media frenzy regarding their potential effects on real estate markets.
Marin's median house sales price is about the same on a year-over-year basis, but in 2018, the May and June prices were higher than in April. There are still 2 months of spring selling season to go and we may see further increases. Generally speaking, supply and demand dynamics are cooler than the market of spring 2018, but some other Bay Area counties have seen larger changes, such as median sales price declines.
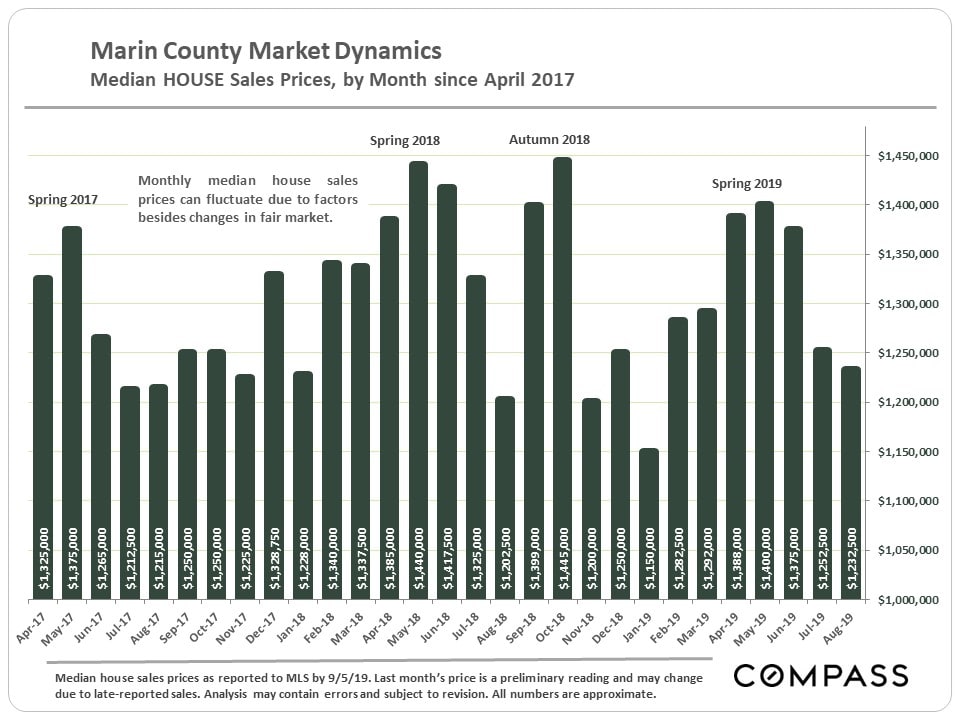
Monthly Median House Sales Prices - 2 Years
Marin's monthly median sales prices tend to fluctuate more dramatically than in other counties - which is why we prefer using quarterly or longer period data - but the below chart illustrates the trend over the past 2 years, including the common effect of seasonality. 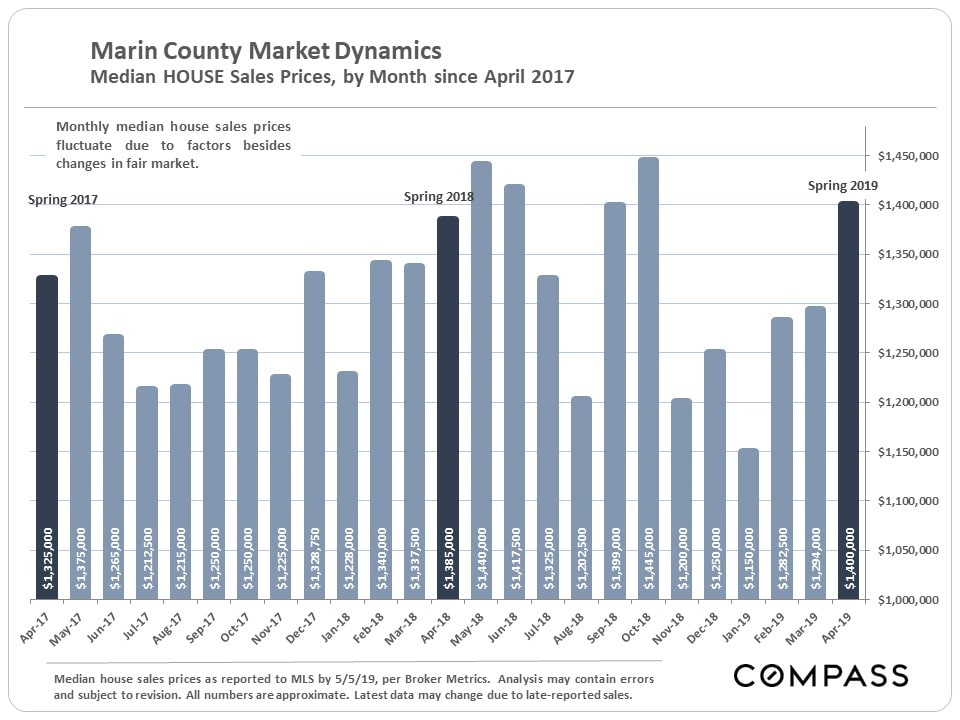 This table compares the March-April market statistics of 2018 and 2019. Many of the year-over-year changes are relatively minor - and 2 months data should still be considered short term until substantiated over the longer term. The data for the full second quarter, April through June, will be a more definitive indicator.
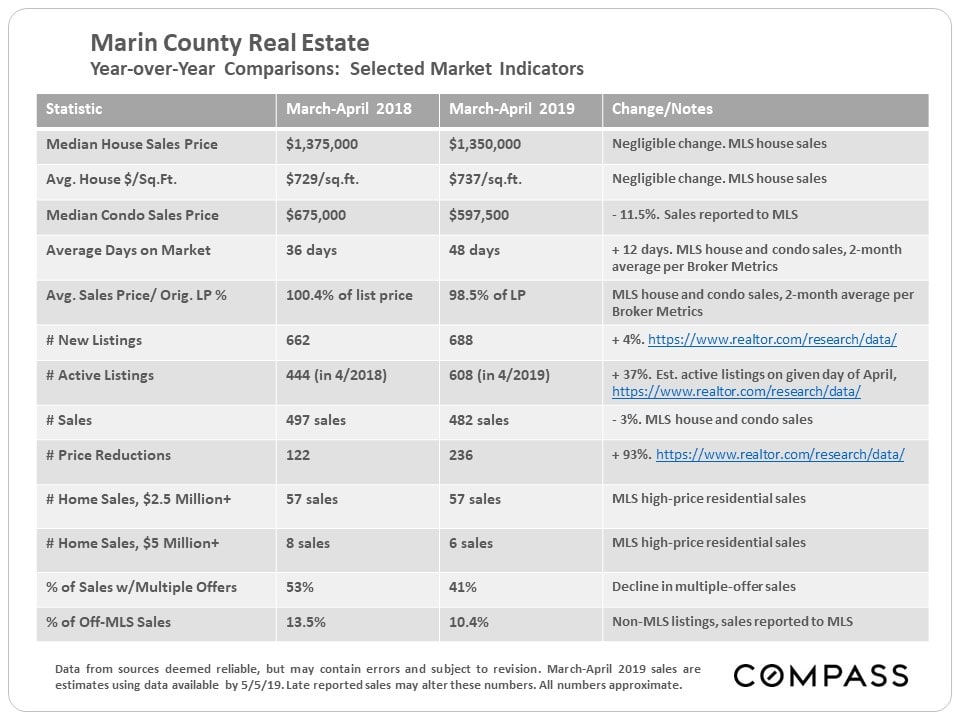
An illustration of the last 12 months of house and condo sales broken out by price range and number of bedrooms.


Home Sales by Price Segment & Bedroom Count
An illustration of the last 12 months of house and condo sales broken out by price range and number of bedrooms. 
House Sales Volumes, Median Prices & Median Sizes
The next chart breaks out the number of house sales over the past 12 months by city, with median house sales prices, median square footage, and median bedroom/ bathroom count. (Median means half the sales were for more, or larger size, and a half for less, or smaller size.)Many of Marin's cities and towns are relatively small markets. Belvedere had the highest median sales price and largest median house size, but relatively few sales.

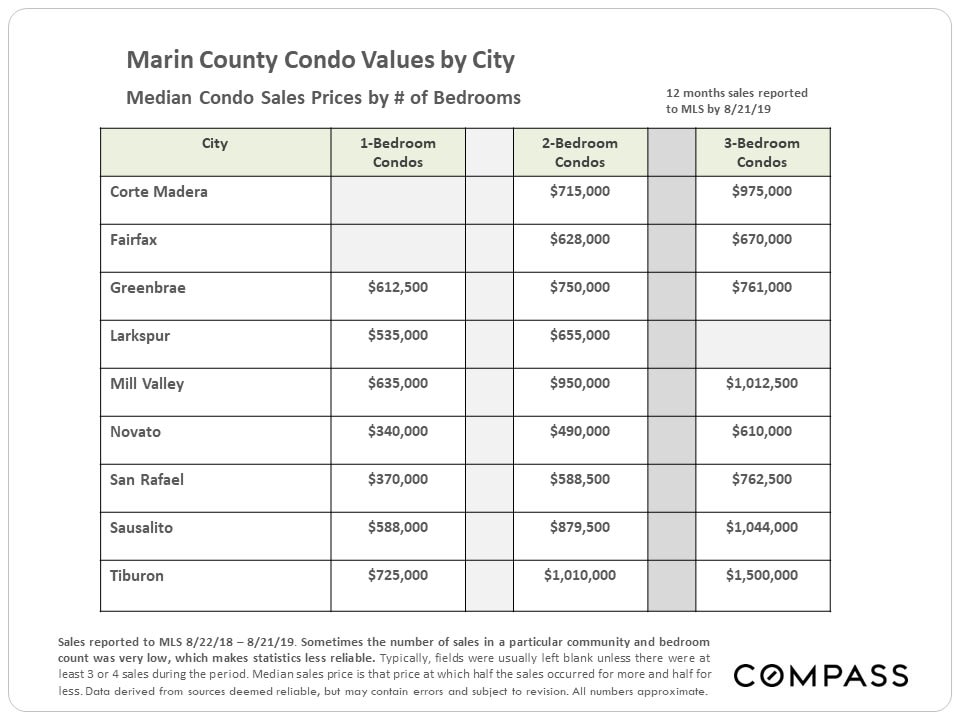
Condo Sales Volumes & Median Prices by City
The median condo sales price in Marin - $660,000 - runs about half of the median house sales price.
Luxury Home Sales & $/Sq.Ft Values
We typically consider the luxury home market in Marin to begin somewhere in the $2.5m to $3 million range - constituting the top 10% of house sales - though what one buys for any price varies radically by location. The biggest luxury markets are exactly where one would expect: Belvedere, Ross, Tiburon, Kentfield and Mill Valley (not in that order by sales volume), though large, beautiful, expensive homes can be found throughout the county. 
Q1 2019 "Ultra-Luxury" Homes Market
The softest segment of the market is the highest-priced - $5 million+ - where the pool of potential buyers is the smallest. In the 1st quarter, as many of these listings expired without selling, as went into a contract or closed sale. Note the differential between the median list prices of the various categories and the final median sales price: Correct pricing is a critical issue for these homes.The second quarter is typically the most active of the year for luxury and ultra-luxury home sales.

Home Size & Era of Construction
Many factors influence home construction size during any particular period: Affluence, economic conditions, household size, buyer age, land costs, population growth, bridge construction, natural disasters, etc. Generally speaking, the median size of Marin houses built during the Victorian and Edwardian eras was substantially larger than those built 1920 - 1959, with new home construction surging after WWII. Sizes then started increasing until now they are larger than ever - however, new house construction has generally plummeted since 1975.Note that the figures below are based on recent home sales and that over the intervening years since original construction, adding a second bathroom to older homes was a very popular renovation.
Over the past few decades, condos have become a major alternative for people purchasing homes of smaller sizes. 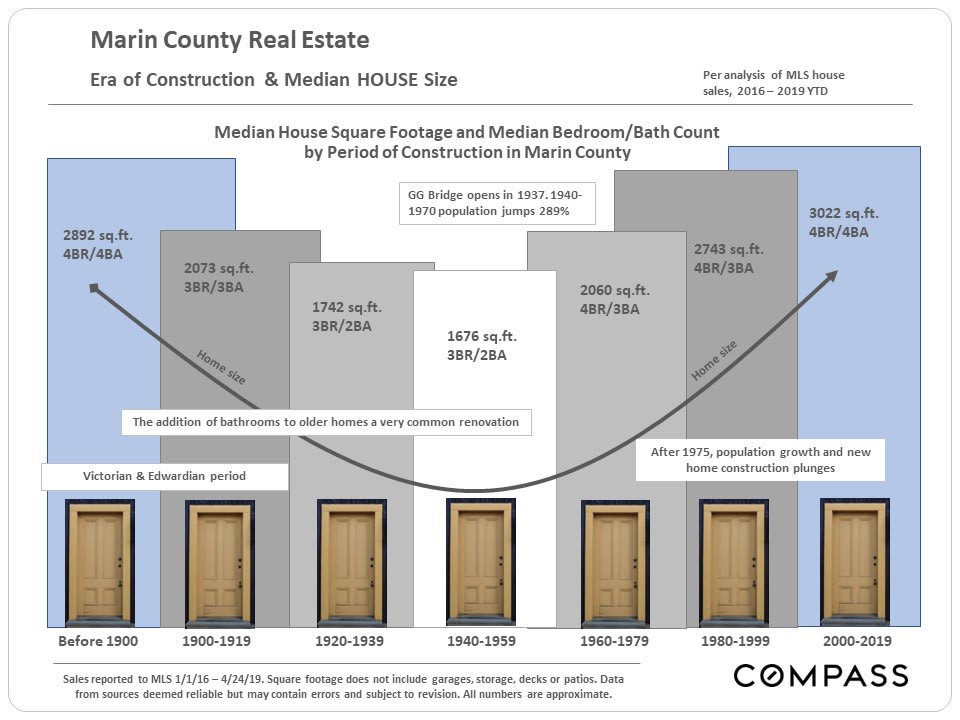
Population Growth (& Decline) per New Census Figures

Selected Demographic & Economic Factors
Population Growth (& Decline) per New Census FiguresPopulation growth slowed significantly around the Bay Area from relatively torrid increase rates from 2010 to 2015/2016. According to recent census figures, Marin saw a small decline since peaking in 2015. 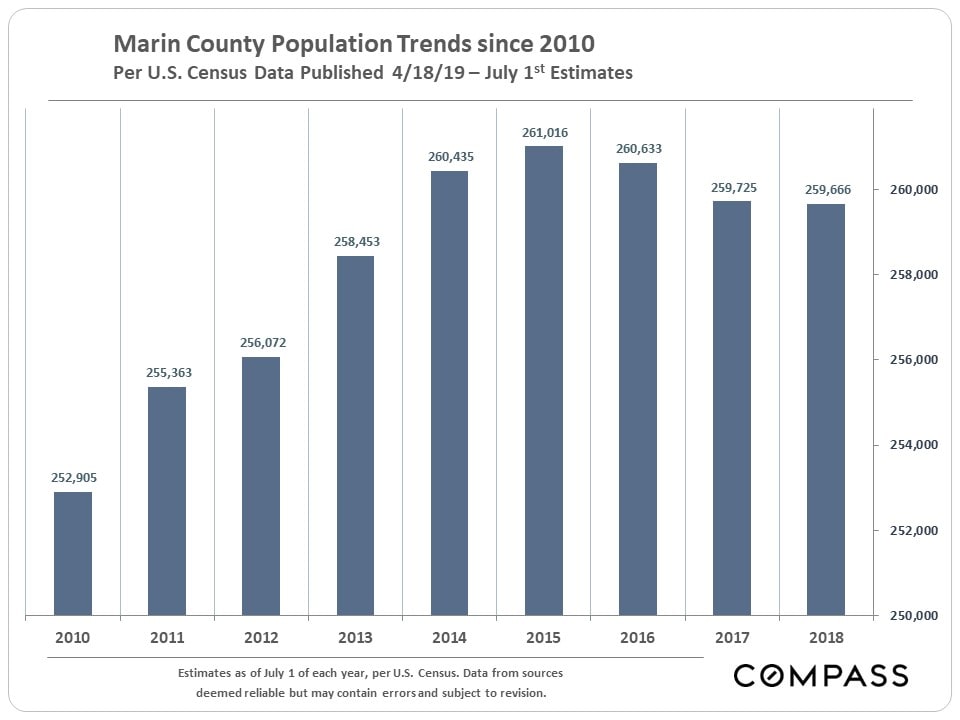 Among Bay Area counties, Marin has ranked second from the last in both total number growth since 2010 (illustrated below), and by percentage increase (2.9%). The 3 North Bay counties have not seen the intense population increases which have occurred in other counties in recent years - and, of course, that is exactly what many of its residents prefer.

Population growth can be a major factor in supply and demand dynamics in real estate markets.

Commuting

Venture Capital Investment
In recent years, the Bay Area has been the biggest destination of venture capital investment dollars in the country - and probably the world. These tens of billions of dollars have constituted a massive factor in the local economy, supercharging the creation of new companies, hiring, and, eventually, IPOs. Ultimately, venture capital is seed money that in the last decade has exploded into the creation of stupendous amounts of new wealth.
Compass is a real estate broker licensed by the State of California, DRE 01527235. Equal Housing Opportunity. This report has been prepared solely for information purposes. The information herein is based on or derived from information generally available to the public and/or from sources believed to be reliable. No representation or warranty can be given with respect to the accuracy or completeness of the information. Compass disclaims any and all liability relating to this report, including without limitation any express or implied representations or warranties for statements contained in, and omissions from, the report. Nothing contained herein is intended to be or should be read as any regulatory, legal, tax, accounting or other advice and Compass does not provide such advice. All opinions are subject to change without notice. Compass makes no representation regarding the accuracy of any statements regarding any references to the laws, statutes, or regulations of any state are those of the author(s). Past performance is no guarantee of future results.